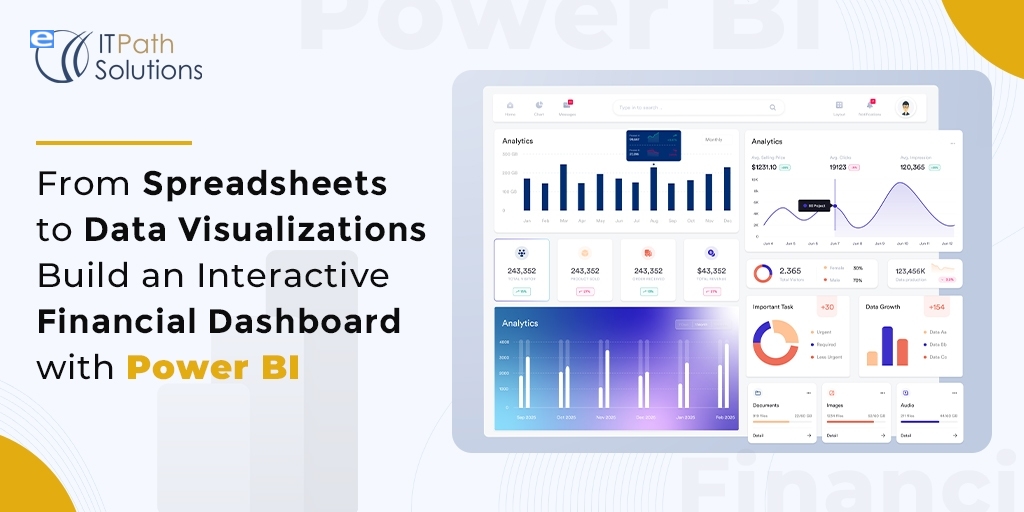
From Spreadsheets to Data Visualizations: Build an Interactive Financial Dashboard with Power BI
Unlock the power of data-driven financial intelligence with this comprehensive guide to Power BI dashboards. Transform static spreadsheets into dynamic visuals that bring your key financial metrics to life. Gain real-time insights into revenue, expenses, profitability, and more through interactive dashboards tailored to your business needs. Discover how to connect multiple data sources, create compelling visualizations, and leverage advanced analytics to uncover hidden trends and opportunities. Empower your team with self-ser
